Strategic Analysis & Intelligence Center
Diagnostic frameworks (SWOT/TOWS, PESTLE, Porter's Five Forces, VRIO), 1-click factor converters, assumptions, evidence sources, Mendelow stakeholder matrix, and competitor intelligence.
1. Overview & Business Value#
This comprehensive operational guide details the architecture, business workflows, configuration parameters, and execution steps for Strategic Analysis & Intelligence Center within SmartERP.
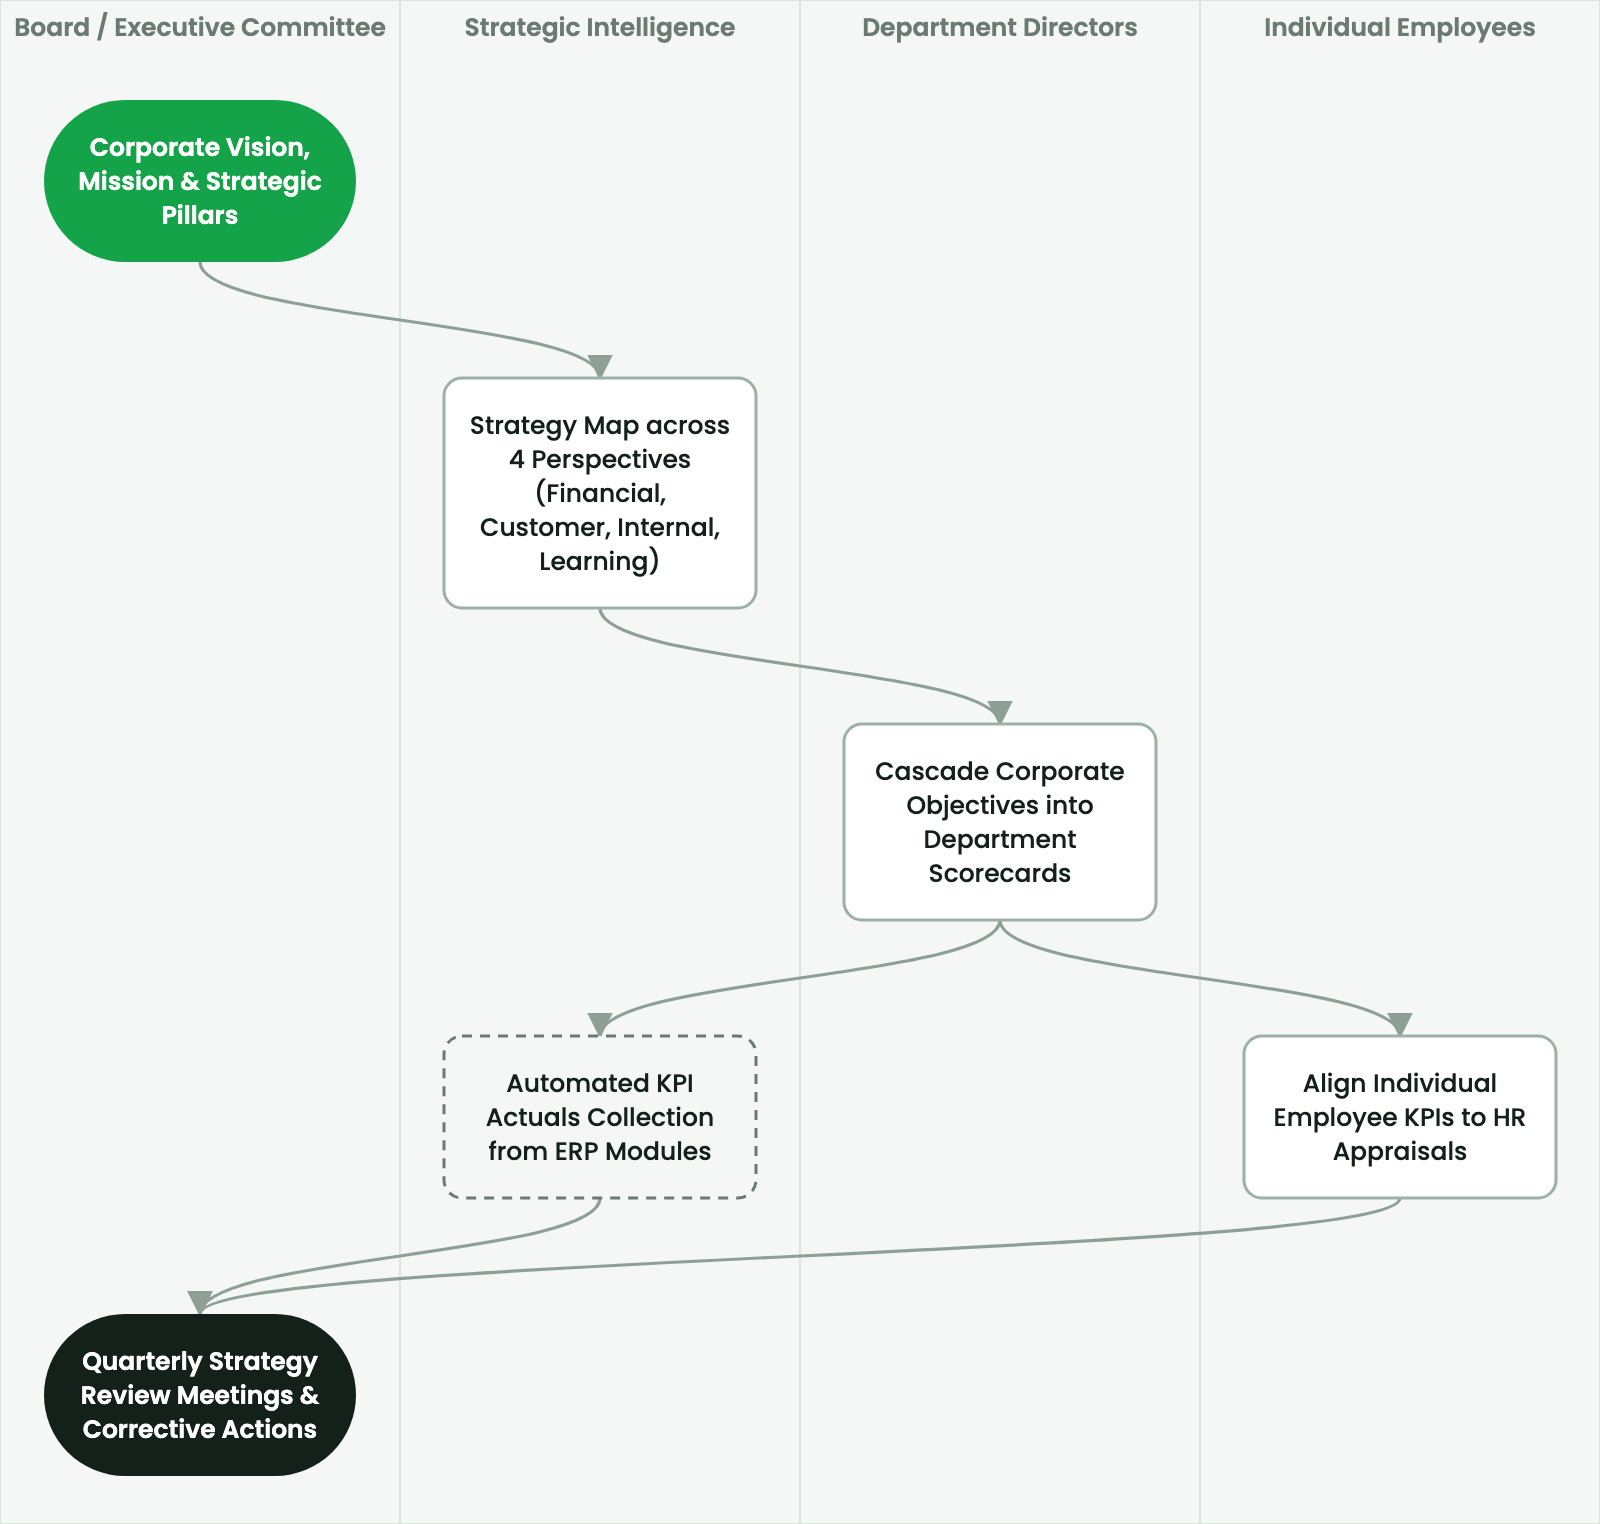
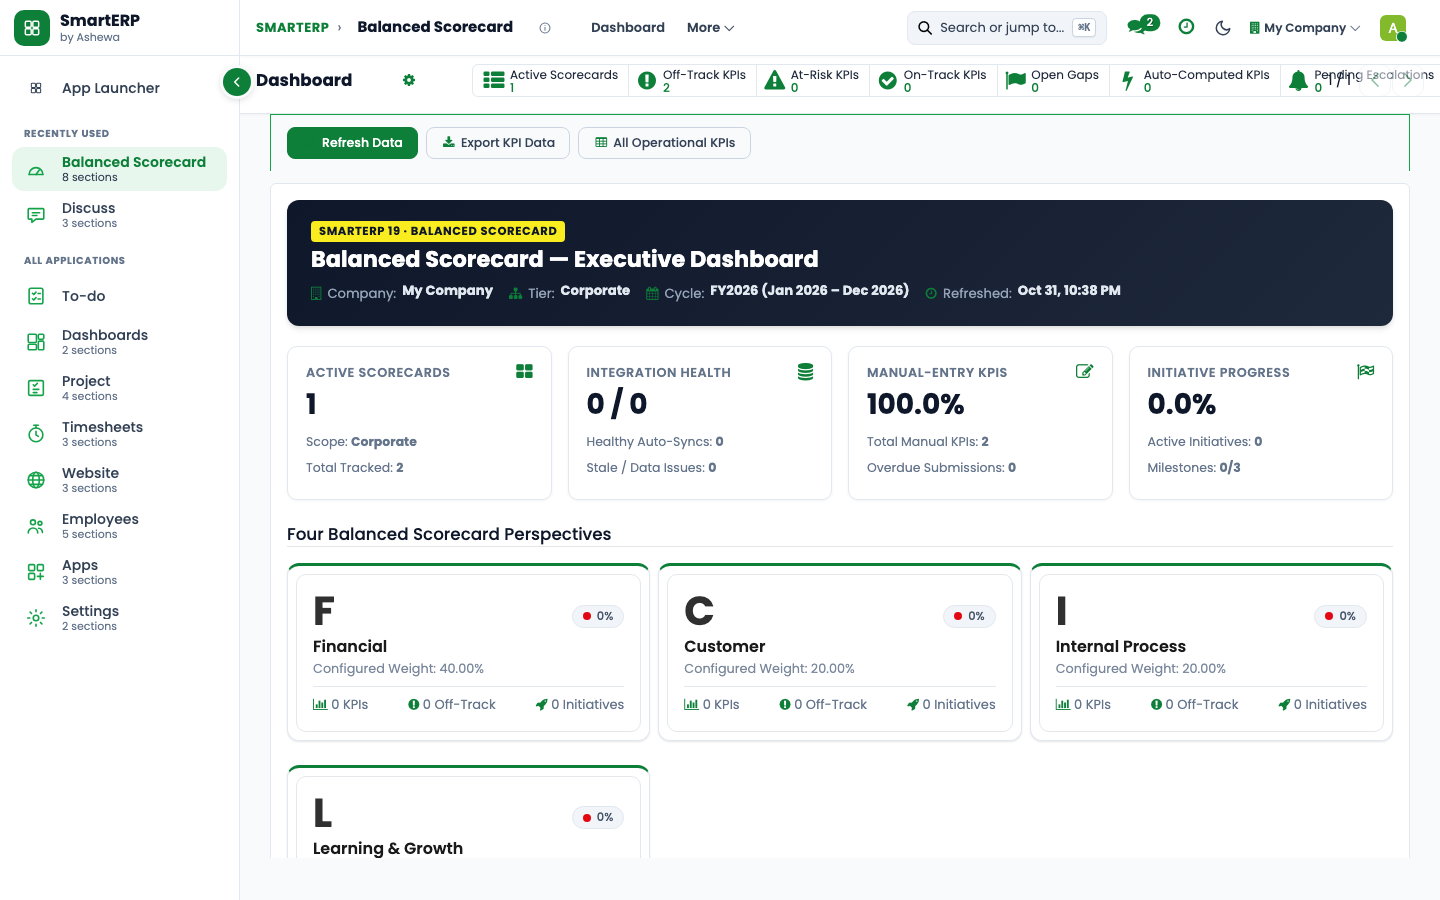
Strategy formulation is only as sound as the empirical analysis behind it. The Analysis & Intelligence Center in SmartERP 19 BSC V3 equips leadership teams with a structured diagnostic laboratory to systematically evaluate internal capabilities, external forces, competitive pressures, and stakeholder dynamics before committing corporate capital.
2. Prerequisites & Security Access Groups#
- Required Modules:
smarterp_balanced_scorecard, smarterp_strategy - Security Groups:
Strategy Officer(Technical ID:smarterp_balanced_scorecard.group_bsc_user)Strategy Director(Technical ID:smarterp_balanced_scorecard.group_bsc_manager)Executive Committee Member(Technical ID:smarterp_balanced_scorecard.group_bsc_executive)
- Master Data Dependencies: Strategic themes, 4 BSC perspectives (Financial, Customer, Internal Process, Learning & Growth), corporate KPIs, and quarterly appraisal periods.
3. Step-by-Step Configuration & Execution#
Step 1: Navigating to the Interface#
- Log into your SmartERP instance at
https://smarterp.et/odoo. - Open the main App Switcher (grid icon in the top-left corner).
- Navigate to Balanced Scorecard → Strategic Dashboard.
Step 2: Operational Data Parameters & Controls#
Ensure all mandatory parameters comply with enterprise operational standards:
- Authorized Operator: Action executed under assigned RBAC permissions (Chief Executive Officer, Corporate Planning Director, Strategy Lead).
- Relational Integrity: Linked to upstream master records, approval requests, or transactional ledgers.
- Statutory & Quality Controls: Verified against Ethiopian statutory regulations and corporate governance standards.
Step 3: Operational Execution & State Progression#
- State Progression Gate: Advance record from Draft through Audited to Confirmed / Certified.
- Integrated System Impact: Automatically updates real-time operational states and posts financial/inventory journal moves.
- Audit Verification: System registers tamper-evident audit records logging user ID, timestamp, and cryptographic transaction digests.
Supported Diagnostic Frameworks#
When initiating a new diagnostic session (Balanced Scorecard $\rightarrow$ Analysis & Intelligence $\rightarrow$ Strategic Diagnostics), planners choose from five industry-standard methodologies:
| Framework | Analytical Scope | Diagnostic Focus |
|---|---|---|
| SWOT / TOWS Matrix | Internal & External | Strengths, Weaknesses, Opportunities, Threats, and Cross-Matrix strategic pairings (SO, ST, WO, WT). |
| PESTLE Analysis | Macro-Environmental | Political, Economic, Social, Technological, Legal, and Environmental external drivers. |
| Porter's Five Forces | Industry Market Structure | Threat of New Entrants, Bargaining Power of Buyers, Threat of Substitutes, Bargaining Power of Suppliers, Competitive Rivalry. |
| VRIO Framework | Internal Resource Moats | Value, Rarity, Inimitability, and Organizational Readiness of proprietary core capabilities. |
| General Strategy Review | Comprehensive Synthesis | Open-form structured executive synthesis combining qualitative and quantitative diagnostics. |
Diagnostic Factor Priority Scoring Engine#
Every analytical session contains granular Diagnostic Factors (bsc.analysis.factor). To ensure leadership focuses on the highest-leverage items rather than exhaustive wish lists, SmartERP evaluates each factor using a quantitative priority formula:
$$\text{Priority Score} = \text{Impact (1 to 5)} \times \text{Probability / Likelihood (1 to 5)}$$
- Impact (1–5): The magnitude of organizational consequence (1 = Negligible, 5 = Catastrophic or Transformational).
- Probability (1–5): The empirical likelihood of occurrence (1 = Remote, 5 = Imminent / Highly Probable).
- Priority Score (1–25): Displayed as an intuitive visual progress gauge. Scores between 16 and 25 represent Tier-1 executive priorities requiring immediate board-level attention.
Factor Attributes & Tactical Categorization#
- Category: Categorized according to the active framework:
- SWOT: Strength, Weakness, Opportunity, Threat.
- PESTLE: Political, Economic, Social, Technological, Legal, Environmental.
- Porter's: Rivalry, Entrants, Suppliers, Buyers, Substitutes.
- VRIO: Value, Rarity, Inimitability, Organization.
- Urgency:
High,Medium, orLow. - Time Horizon:
Immediate (< 6m),Medium-Term (1-2y),Long-Term (3-5y). - Strategic Response: Direct action directive:
- Strengths / Opportunities: Capitalize Moat, Invest & Expand, Partner / Acquire.
- Weaknesses / Threats: Mitigate & Hedge, Divest / Exit, Contain.
1-Click Action Converters: Bridging Analysis to Execution#
In traditional consulting decks, SWOT analyses gather dust because there is no mechanical link from findings into the ERP execution backlog. SmartERP BSC V3 eliminates this gap with 1-Click Action Converters:
1. Converting a Factor into a Strategic Objective#
When an analytical finding represents a positive capability or growth opportunity:
- Open the Diagnostic Factor row.
- Click the Make Objective action button (bullseye icon).
- The system automatically creates a new
bsc.objectiverecord:- Populates the Objective title from the factor description.
- Links the governing Strategic Plan.
- Sets the default perspective (e.g., Opportunities map to Customer / Market or Financial).
- Writes the back-link on the factor row (
converted_objective_id) so audits can trace the exact analytical origin of every corporate objective.
2. Converting a Factor into a Strategic Risk#
When an analytical finding identifies an operational vulnerability, regulatory headwind, or competitive threat:
- Open the Diagnostic Factor row.
- Click the Make Risk action button (warning triangle icon).
- The system automatically creates a new
bsc.riskrecord:- Automatically maps the Impact and Probability ratings into the $5 \times 5$ Risk Heatmap.
- Inherits the plan reference and risk category (e.g., Threats map to Market, Financial, or Compliance).
- Writes the back-link on the factor row (
converted_risk_id), locking the converter button to prevent duplicate entries.
Strategic Assumptions & Verifiable Evidence Sources#
To maintain empirical truth and prevent wishful thinking:
- Key Strategic Assumptions (
bsc.analysis.assumption):- Records foundational business premises (e.g., "National GDP growth will remain above 6.5%", "Telebirr transaction processing fees will remain capped at 0.5%").
- Tracks Validation Status:
Pending Investigation,Empirically Validated,Disproven / Invalidated. - Monitors Sensitivity Rating:
Critical (Plan-Breaking),High,Moderate,Low. - Assigns an Assumption Custodian with a mandatory Review By Date.
- Verifiable Evidence Sources (
bsc.evidence.source):- Links every strategic assertion to demonstrable proof.
- Supported source types: ERP Operational Data, Government & Ministry Publications (e.g. MInT, NBE), Audited Financial Statements, Third-Party Analyst Research, Customer Survey Data.
- Stores reference URLs, collection dates, and reliability ratings (
A: Highly AuthoritativetoD: Unverified Opinion).
Mendelow Stakeholder Engagement Matrix#
Successful strategies require deliberate stakeholder alignment. Under Analysis & Intelligence $\rightarrow$ Stakeholder Matrix, planners configure the Mendelow Power vs. Interest Matrix:
                  High Power
                      │
   KEEP SATISFIED     │    MANAGE CLOSELY
  (High Power,        │   (High Power,
   Low Interest)      │    High Interest)
 ─────────────────────┼─────────────────────
      MONITOR         │    KEEP INFORMED
  (Low Power,         │   (Low Power,
   Low Interest)      │    High Interest)
                      │
                  Low Power
Low Interest ─────────────────────── High Interest| Quadrant | Power / Interest | Strategy & Mandate | Example Stakeholders |
|---|---|---|---|
| Manage Closely | High Power / High Interest | Primary decision partners. Engage weekly/monthly. Satisfy key expectations proactively. | Board of Directors, Ministry of Innovation & Technology (MInT), Core Enterprise Clients, Executive Committee. |
| Keep Satisfied | High Power / Low Interest | High leverage, passive interest. Keep compliant, avoid friction, consult during major governance pivots. | Tax Authorities (ECC / MOR), Financial Regulators (NBE), Strategic Cloud Hosting Providers. |
| Keep Informed | Low Power / High Interest | Deep emotional or operational investment. Communicate regular milestone updates and newsletters. | Employees, Middle Management, Developer Community, Industry Associations. |
| Monitor | Low Power / Low Interest | Minimal immediate impact. Periodic environmental scanning with minimal resource allocation. | Peripheral vendors, general public, distant competitor moves. |
Competitor Intelligence & Moat Analysis#
Under Analysis & Intelligence $\rightarrow$ Competitor Intelligence, strategic planners maintain continuous intelligence profiles on market rivals:
- Competitor Classification:
Tier 1: Direct Competitor,Tier 2: Indirect Alternative,Tier 3: Emerging Disruptor. - Market Share %: Estimated share of total addressable market.
- Threat Rating:
Existential,High,Medium,Low. - Moats & Defensibility: Analyzes competitor service gaps, pricing rigidities, proprietary features, and documents precisely why and how SmartERP captures market share against them.
4. Advanced Configuration Points#
- Automated Actions & Scheduled Tasks (Crons):
BSC: Calculate quarterly KPI achievements(smarterp_bsc.ir_cron_compute_kpi): Runs quarterly on the 5th to compute composite achievement scoresBSC: Issue appraisal cascade reminders(smarterp_bsc.ir_cron_appraisal_alert): Runs monthly to remind objective champions to update progress
- Custom Print Templates & Reports:
- Institutional Balanced Scorecard Executive Dashboard
- Departmental Strategic Cascade Matrix
- KPI Performance Variance & Trend Analysis
- Corporate Strategy Execution Summary
- Multi-Company Rules: Record-level security isolation under Company 1 (
Ashewa Technology Solutions S.C.), preventing cross-company ledger leakage across parent and subsidiary legal entities.
5. Comprehensive Troubleshooting Matrix#
| Error Symptom / Exception | Probable Root Cause | Corrective Action / Resolution |
|---|---|---|
Weighting Error: Perspective weights do not equal 100% | Total weights assigned to objectives within perspective fail to sum to 100.00%. | Adjust individual objective weightings so the perspective total equals exactly 100%. |
Data Feed Error: Automated KPI metric returned null | Underlying model query failed or target database view has no records. | Verify connected model name and filter domain in the KPI automated calculation parameters. |
Lockout Error: Period results locked for executive review | Current appraisal quarter has been locked by the Strategy Director. | Obtain written authorization and request temporary unlock from the Strategy Director. |