Executive Dashboard & Performance Reviews
Real-time corporate RAG health index, executive QPR meetings, minutes, decision registries, and automated KPI escalation alerts.
1. Overview & Business Value#
This comprehensive operational guide details the architecture, business workflows, configuration parameters, and execution steps for Executive Dashboard & Performance Reviews within SmartERP.
Executive Dashboard & Performance Reviews#
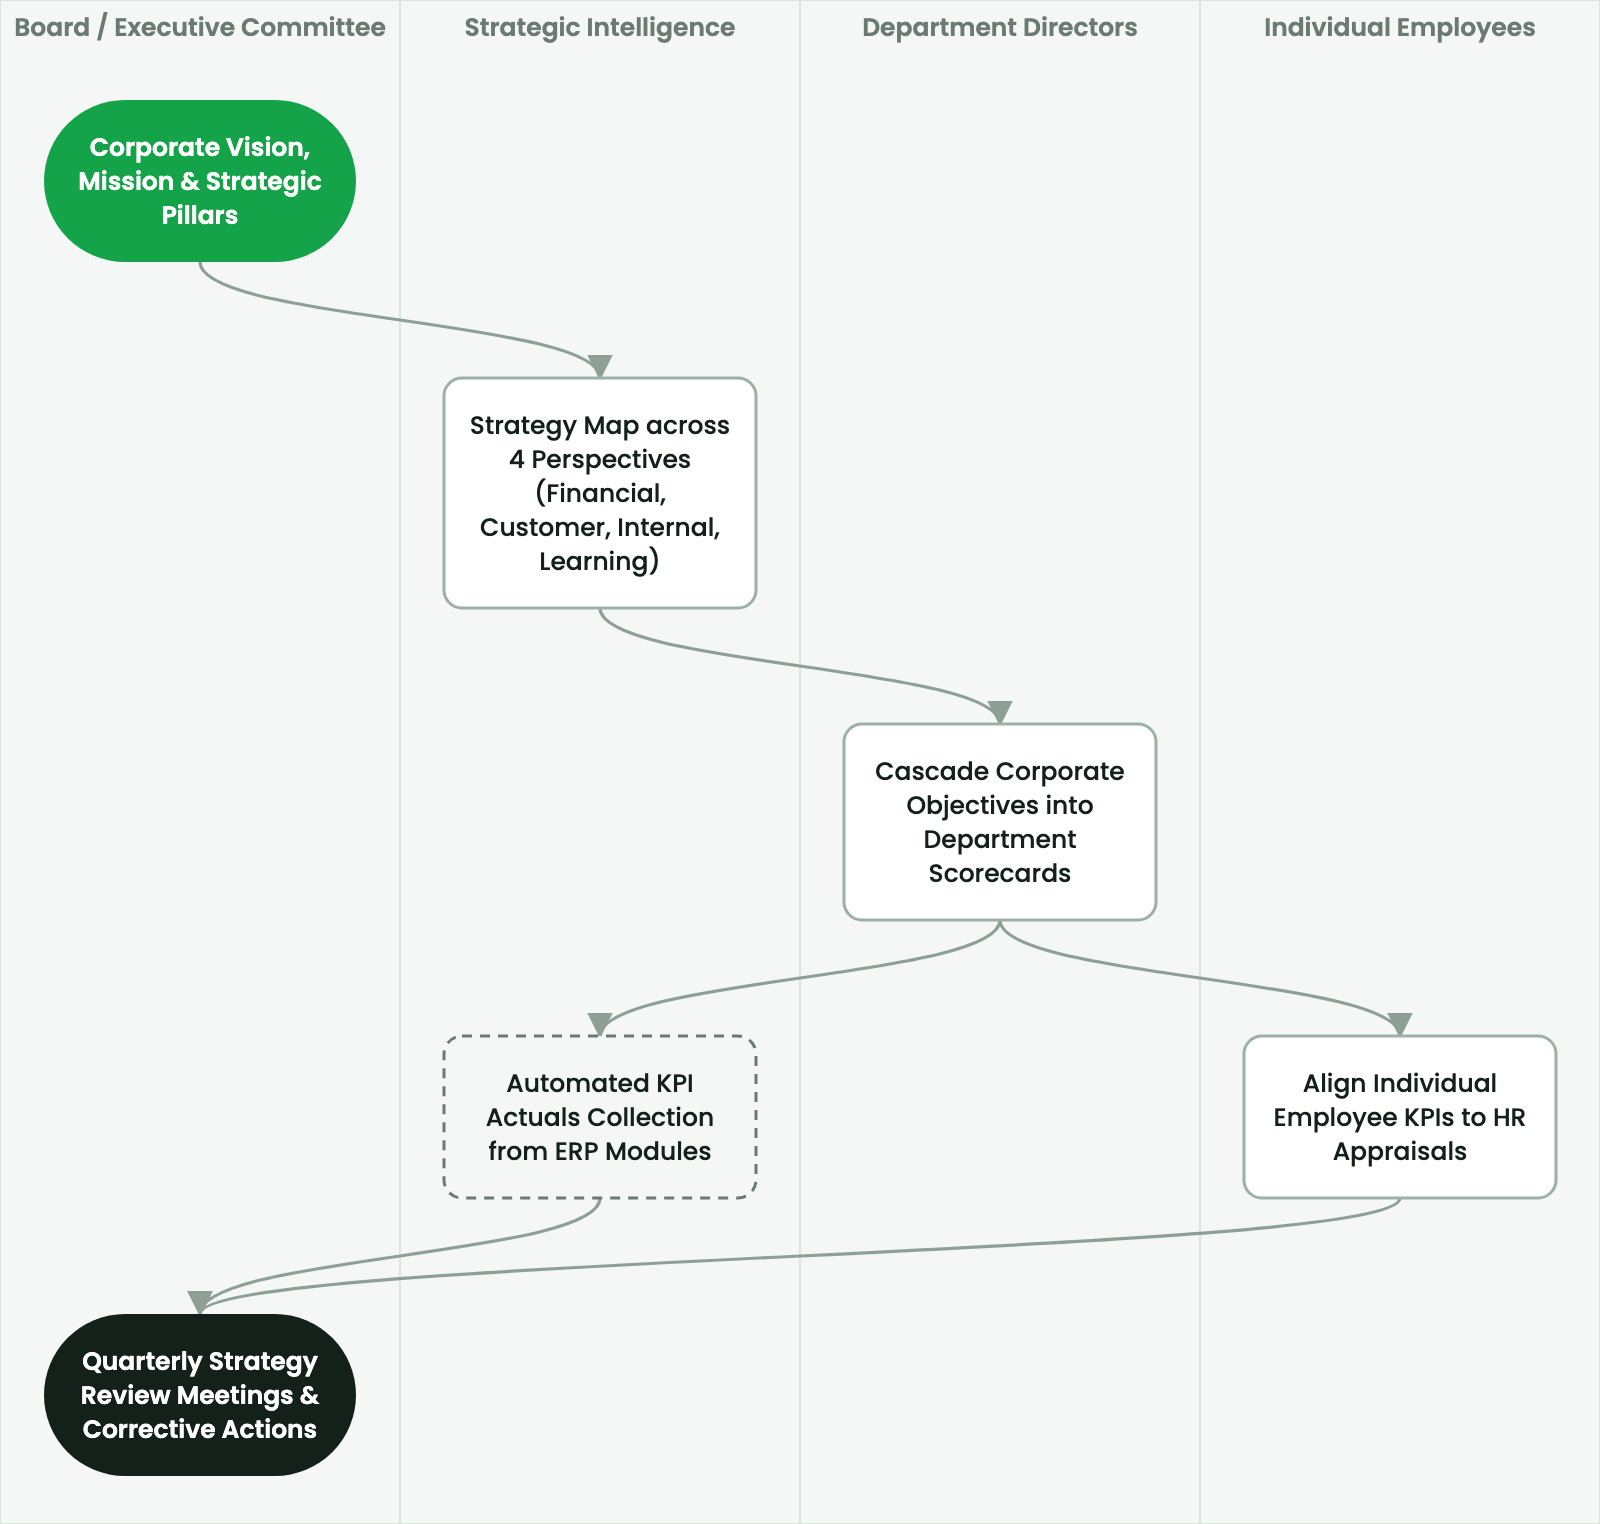
A strategic plan is only as effective as the governance rhythm that reviews it. SmartERP BSC V3 combines an executive Real-Time Performance Dashboard with structured Quarterly Performance Reviews (QPR).
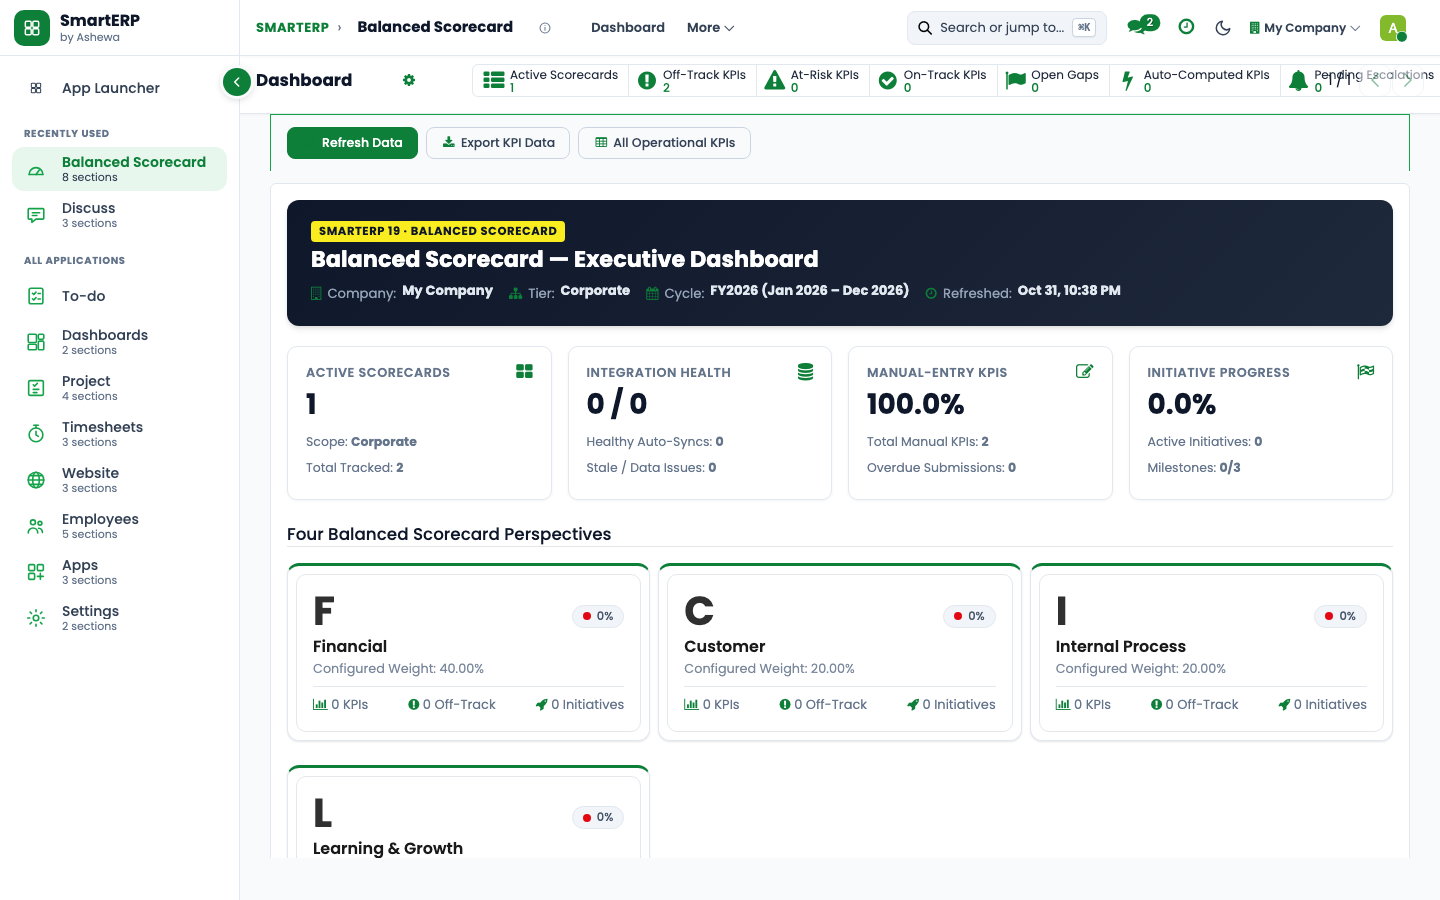
Figure 6.5: Consolidated Executive Performance Dashboard tracking Corporate Index (88.4%), live General Ledger actuals, Strategic Risks, and Red KPI Escalations.
2. Prerequisites & Security Access Groups#
- Required Modules:
smarterp_balanced_scorecard, smarterp_strategy - Security Groups:
Strategy Officer(Technical ID:smarterp_balanced_scorecard.group_bsc_user)Strategy Director(Technical ID:smarterp_balanced_scorecard.group_bsc_manager)Executive Committee Member(Technical ID:smarterp_balanced_scorecard.group_bsc_executive)
- Master Data Dependencies: Strategic themes, 4 BSC perspectives (Financial, Customer, Internal Process, Learning & Growth), corporate KPIs, and quarterly appraisal periods.
3. Step-by-Step Configuration & Execution#
Step 1: Navigating to the Interface#
- Log into your SmartERP instance at
https://smarterp.et/odoo. - Open the main App Switcher (grid icon in the top-left corner).
- Navigate to Balanced Scorecard → Strategic Dashboard.
Step 2: Operational Data Parameters & Controls#
Ensure all mandatory parameters comply with enterprise operational standards:
- Authorized Operator: Action executed under assigned RBAC permissions (Chief Executive Officer, Corporate Planning Director, Strategy Lead).
- Relational Integrity: Linked to upstream master records, approval requests, or transactional ledgers.
- Statutory & Quality Controls: Verified against Ethiopian statutory regulations and corporate governance standards.
Step 3: Operational Execution & State Progression#
- State Progression Gate: Advance record from Draft through Audited to Confirmed / Certified.
- Integrated System Impact: Automatically updates real-time operational states and posts financial/inventory journal moves.
- Audit Verification: System registers tamper-evident audit records logging user ID, timestamp, and cryptographic transaction digests.
1. Executive Dashboard Architecture (bsc.dashboard)#
The dashboard surfaces four executive KPI widgets and dual drill-down workspaces:
- Corporate Scorecard Index: Weighted aggregate of all 4 perspectives, indicating overall corporate health.
- Financial Execution (GL Live Actuals): Compares actual revenue and operating expenses against budgeted targets directly from posted accounting journal entries.
- Strategic Risk Counter: Highlights untreated risks, high-impact severity items, and active Key Risk Indicator warnings.
- Milestone Velocity Counter: Monitors upcoming, completed, and overdue strategic checkpoints for the current fiscal quarter.
Real-Time RAG Status Scoring Rules#
The platform automatically classifies objectives, perspectives, and scorecards using standard RAG criteria:
- 🟢 Green ($\ge 90.0\%$): Performance is on track or exceeding approved baseline targets.
- 🟡 Amber ($70.0\% - 89.9\%$): Moderate variance requiring operational attention or line-manager review.
- 🔴 Red ($< 70.0\%$): Critical underperformance. Automatically triggers a notification to the responsible executive and logs the item into the Strategic Escalations registry.
2. Conducting Strategy Reviews & QPR Cadence (bsc.review)#
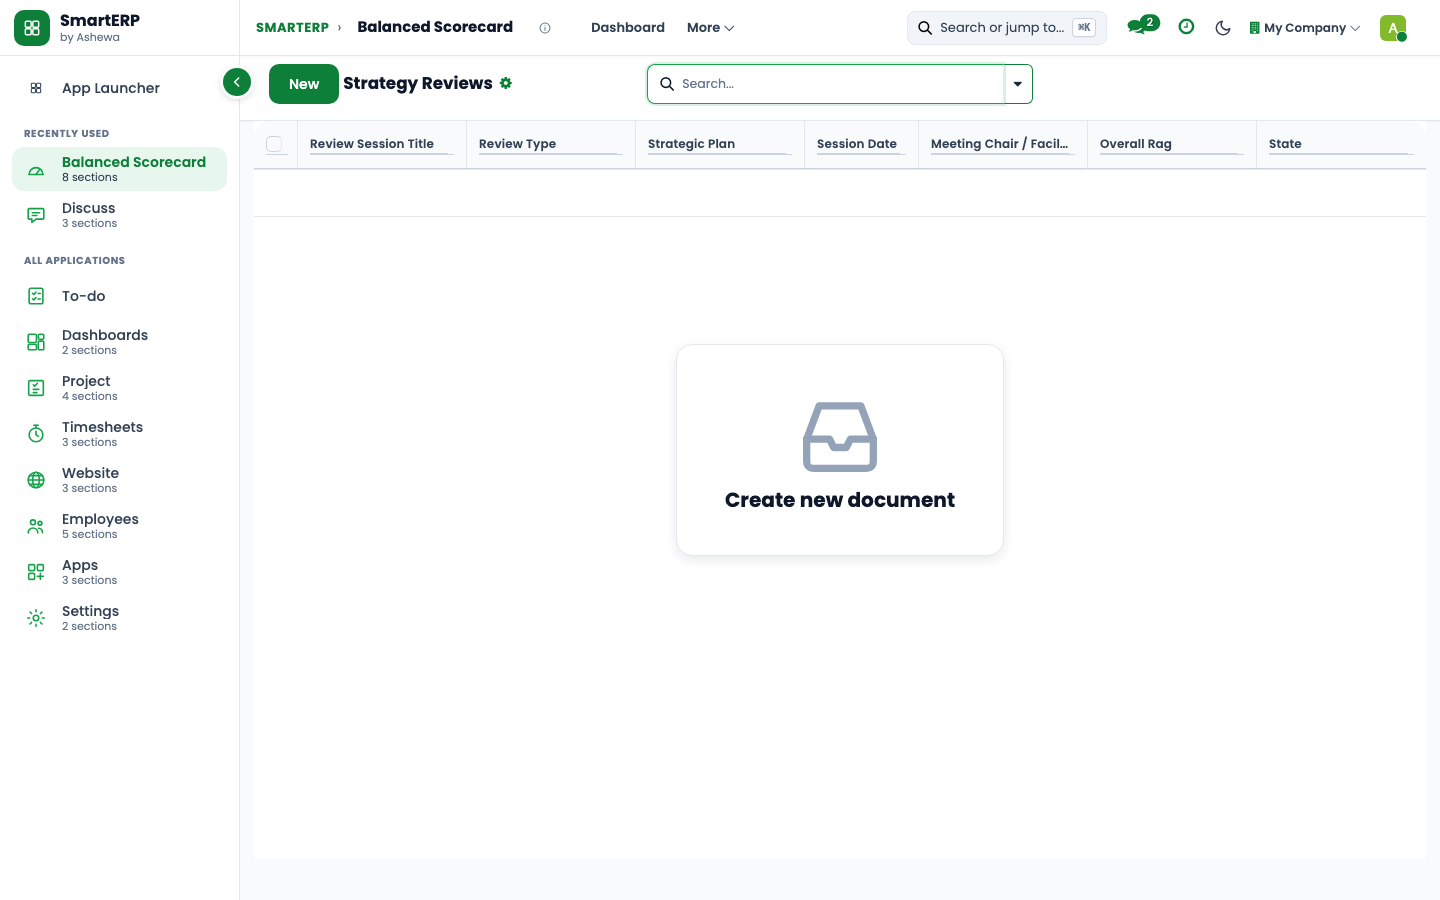
Figure 6.6: Strategy Reviews Workspace managing Quarterly Performance Reviews (QPR), Monthly Operational checks, and Board-level Strategy Pivots.
Review Workflow#
- Schedule: The Strategy Director or PMO creates a new review record:
- Review Name: (e.g., 2026 Q3 Corporate Strategy & Performance Review).
- Cadence:
Monthly Operational,Quarterly (QPR),Semi-Annual, orAnnual Strategic. - Chair / Sponsor: Designated executive meeting chair.
- Pre-Meeting Pack: The system compiles a read-only snapshot of all KPIs, actual vs. target variances, and overdue milestones.
- Meeting Minutes & Decisions:
- Participants record agreed strategic pivots and budget adjustments.
- Decisions are logged into the Decision Log, recording who proposed the pivot, who approved it, and any revised resource envelopes.
- Sign-off: Marking the review as Completed locks the minutes and distributes action items to scorecard owners.
3. Advanced FY2019 E.C. Executive Dashboard & Top Movers Engine#
For enterprise leadership tracking high-velocity execution across FY2019 E.C., SmartERP provides an interactive Executive Balanced Scorecard Dashboard with integrated month-over-month trajectory tracking (Top Movers).
3.1 Architecture: Automated ERP Aggregation vs. Manual Strategic Targets#
Rather than isolated spreadsheets, the Executive Dashboard binds high-level executive targets directly to live operational journals:
+---------------------------------------------------------------------------------+
|                       EXECUTIVE BALANCED SCORECARD (FY2019 E.C.)                |
|                    Ashewa Technology Solutions S.C. | Overall Index: 88.4%       |
+---------------------------------------------------------------------------------+
|  [ FINANCIAL (92.8%) ]  [ CUSTOMER (89.5%) ]  [ PROCESSES (94.2%) ]  [ PEOPLE (77.1%) ] |
+---------------------------------------------------------------------------------+
|  Strategic Objectives & Operational Progress   |  Top Movers (Monthly Tracking)  |
|  - Revenue (GL Auto): 118.4M ETB (102% Green)  |  ▲ Total Revenue (+8.2% MoM)    |
|  - Project Milestones: 85.7% Progress (Green)  |  ▲ CSAT Enterprise (+4.5% MoM)  |
|  - Blended Gross Margin: 58.0% (Green)         |  ▼ DSO Collection (-3.1% MoM)   |
|  - Dev Certification: 72.0% (Amber)            |  ▼ Engineering Churn (-5.0% Red)|
+---------------------------------------------------------------------------------+
3.2 Solving the "Top Movers" Trend Detection Requirement#
In standard annual scorecards, you may observe the diagnostic notice:
"No trend data yet - Top Movers needs at least 2 monthly periods per KPI to detect a trend (this scorecard's KPIs currently have annual periods only)."
The Operational Solution#
- Multi-Period Configuration: To detect momentum, KPIs must be broken down into discrete monthly intervals (
bsc.kpi.periodwithperiod_type='month'), such as the 12 Ethiopian fiscal calendar months (Hamle, Nehasse, Meskerem, Tikimt, Hidar, Tahsas, Tir, Yekatit, Megabit, Miazia, Ginbot, Sene). - Automated Monthly Trend Cron: The system runs a scheduled action (BSC: Monthly KPI Trend Snapshot) every month:
- Captures the live
actual_valuefrom the general ledger (account.move) or task completion (project.task). - Measures delta against the preceding month snapshot: $$\Delta\% = \frac{\text{Actual}{\text{current}} - \text{Actual}{\text{previous}}}{\text{Actual}_{\text{previous}}} \times 100$$
- Classifies KPIs with positive momentum as Top Improvements and declining trajectories as Top Deteriorations.
- Captures the live
- Immediate Baseline Generation: Planners can trigger the snapshot cron manually via Settings › Technical › Automation › Scheduled Actions › BSC: Monthly KPI Trend Snapshot to establish an instant baseline.
4. Advanced Configuration Points#
- Automated Actions & Scheduled Tasks (Crons):
BSC: Calculate quarterly KPI achievements(smarterp_bsc.ir_cron_compute_kpi): Runs quarterly on the 5th to compute composite achievement scoresBSC: Issue appraisal cascade reminders(smarterp_bsc.ir_cron_appraisal_alert): Runs monthly to remind objective champions to update progress
- Custom Print Templates & Reports:
- Institutional Balanced Scorecard Executive Dashboard
- Departmental Strategic Cascade Matrix
- KPI Performance Variance & Trend Analysis
- Corporate Strategy Execution Summary
- Multi-Company Rules: Record-level security isolation under Company 1 (
Ashewa Technology Solutions S.C.), preventing cross-company ledger leakage across parent and subsidiary legal entities.
5. Comprehensive Troubleshooting Matrix#
| Error Symptom / Exception | Probable Root Cause | Corrective Action / Resolution |
|---|---|---|
Weighting Error: Perspective weights do not equal 100% | Total weights assigned to objectives within perspective fail to sum to 100.00%. | Adjust individual objective weightings so the perspective total equals exactly 100%. |
Data Feed Error: Automated KPI metric returned null | Underlying model query failed or target database view has no records. | Verify connected model name and filter domain in the KPI automated calculation parameters. |
Lockout Error: Period results locked for executive review | Current appraisal quarter has been locked by the Strategy Director. | Obtain written authorization and request temporary unlock from the Strategy Director. |